Calculates conductivity contribution from provided ion concentrations. Uses Kohlrausch's Law. If a total conductivity measurement is not provided the total conductivity is calculated as the sum of all ions present in the data. If the user provides a conductivity measurement then ion contributions are a percentage of that number. In this case "Other" is added as an ion to capture any percentage of total conductivity not represented by the provided ions. Plotting is done outside of this function.
IonContrib(ion.data, ion.ref = NULL, col.Cond = "")Arguments
- ion.data
Input data. Column names match rows in the ref table
- ion.ref
Reference data for ions; Name (matches columns in data), Multiplier, and SortOrder. Default is NULL, uses included ref table.
- col.Cond
Column name with conductivity in "data". Default is blank. If blank only ions present are used to calculate total conductivity for samples.
Value
Returns a data frame with additional fields for "multiplier", "ion conductivity", "total conductivity", "percent contribution" (per ion).
Details
No special libraries are needed for this function.
Examples
# Load Data
data.ion <- MBSS.Ion.Data
# Load Reference Table
ref.ion <- MBSS.Ion.Ref
# Calculate Percent Contribution by Ion (data table only)
contrib.ion <- IonContrib(data.ion)
#> *No* conductivity values provided.
#>
#>         Ion contributions calculated from the sum of calculated ion conductivity
#>         values.
#View(contrib.ion)
# Calculate Percent Contribution by Ion (data table and reference table)
contrib.ion.2 <- IonContrib(data.ion, ref.ion)
#> *No* conductivity values provided.
#>
#>         Ion contributions calculated from the sum of calculated ion conductivity
#>         values.
#View(contrib.ion.2)
# Calculate Percent Contribution by Ion (data table, reference table, and
# conductivity values)
## add dummy conductivity values for each sample
myCond <- "Cond"
data.ion[,myCond] <- 4000
contrib.ion.3 <- IonContrib(data.ion, ref.ion, myCond)
#> Conductivity values provided.
#>
#>         Ion contributions (including 'other') calculated from these values.
#View(contrib.ion.3)
# Save Results (use write.table())
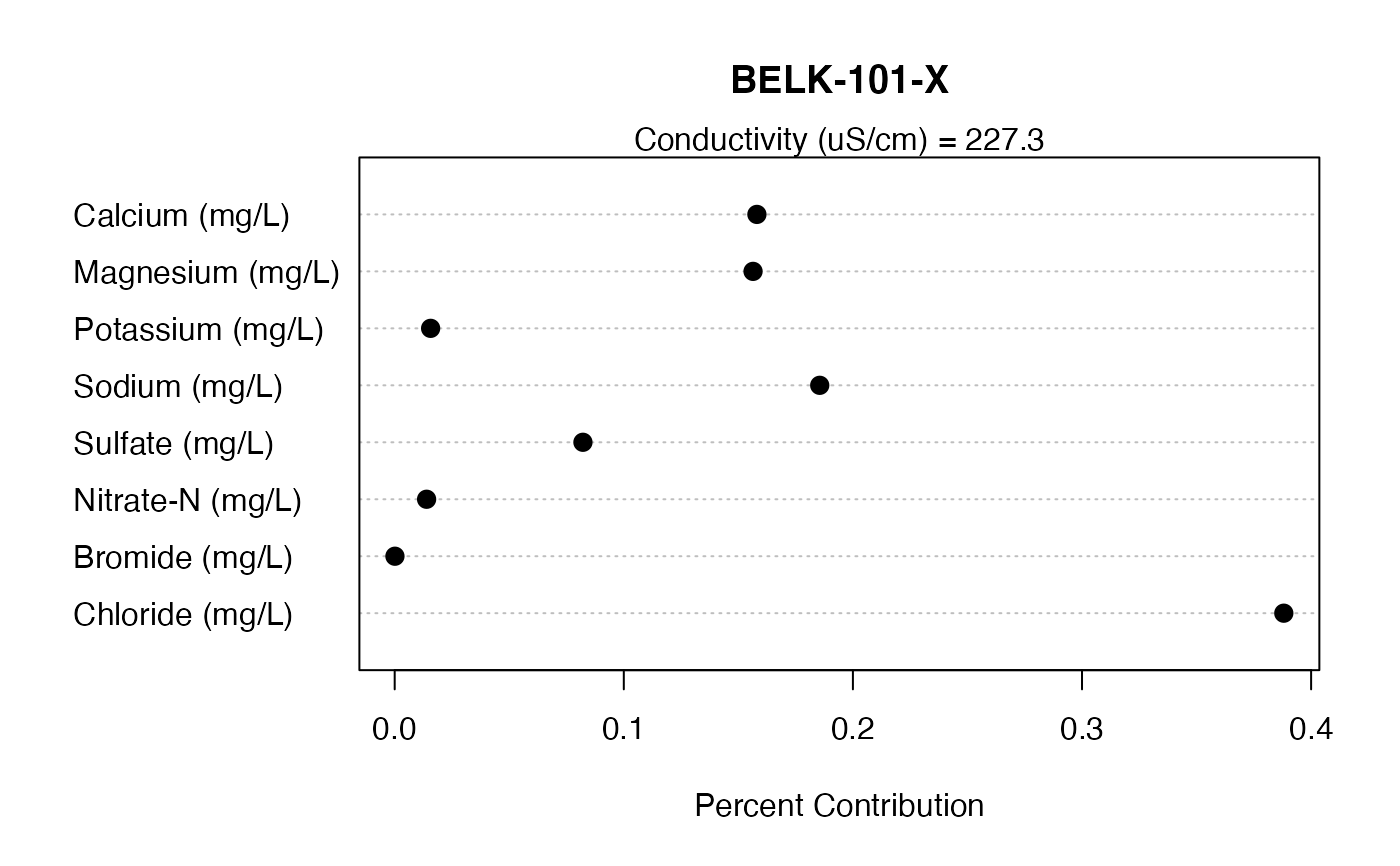
# Plot Results
myIons <- c("Chloride (mg/L)", "Bromide (mg/L)", "Nitrate-N (mg/L)",
"Sulfate (mg/L)", "Sodium (mg/L)",
     "Potassium (mg/L)", "Magnesium (mg/L)",  "Calcium (mg/L)" )
myIons.Contrib <- paste0("PctContrib.",myIons)
mySite <- "BELK-101-X"
data.plot <- subset(contrib.ion, contrib.ion[,"Site"]==mySite,
select=c("Site","Cond.Total",myIons.Contrib,myIons))
## Plot, one site (with cond value)
dotchart(as.numeric(as.vector(data.plot[,myIons.Contrib])), labels=myIons,
main=mySite, xlab="Percent Contribution", pch=19, pt.cex=1.2)
mtext(paste0("Conductivity (uS/cm) = ",round(data.plot[,"Cond.Total"],1)))

## Plot all sites using panel.dotplot() in the lattice package
#
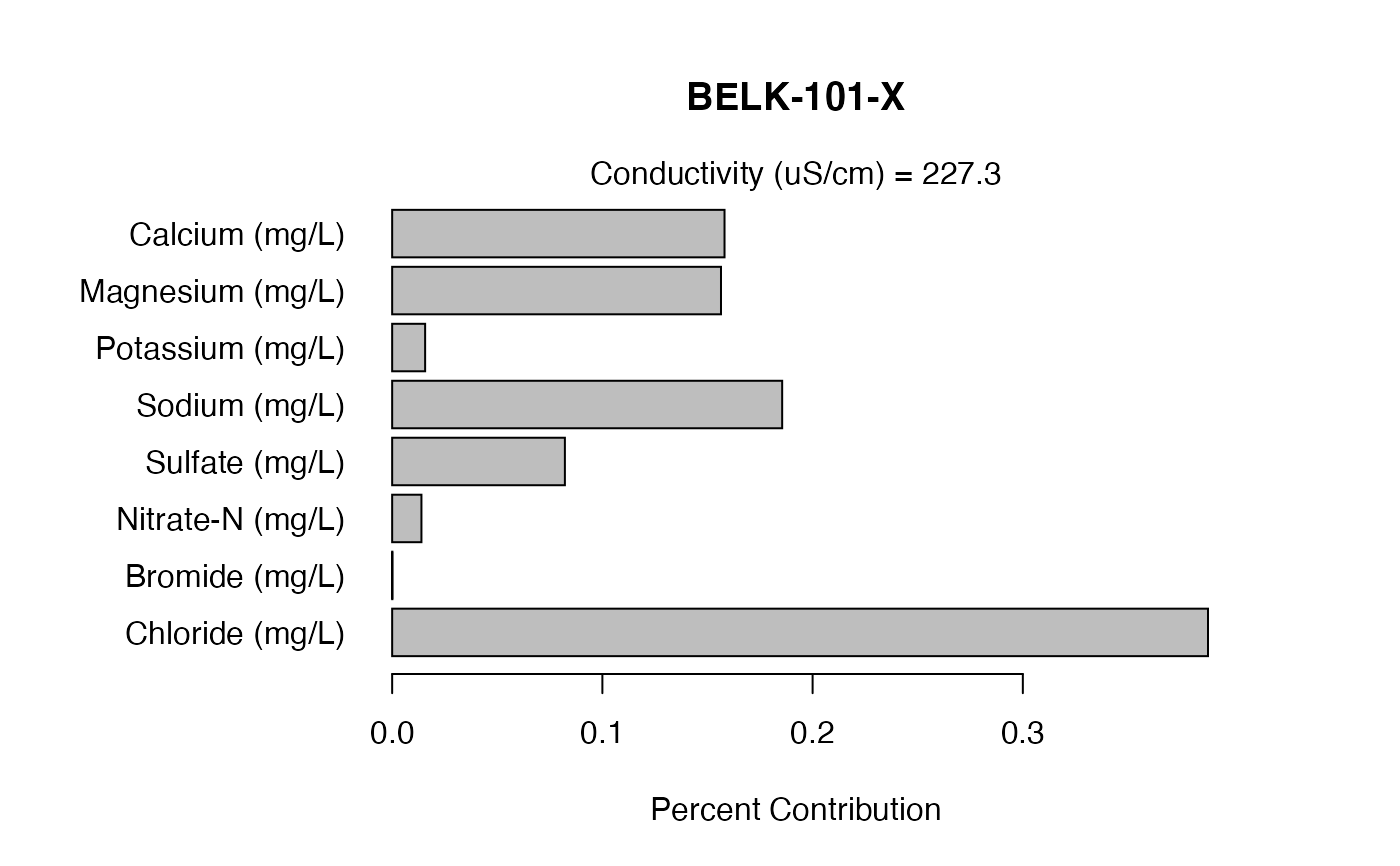
## Plot as a horizontal bar plot
# need to change margins to fit labels
par(mai=c(1,2,1,1))
barplot(as.numeric(as.vector(data.plot[,myIons.Contrib])), names.arg=myIons,
main=mySite, xlab="Percent Contribution"
       , axes=TRUE, horiz=TRUE, las=1)
mtext(paste0("Conductivity (uS/cm) = ",round(data.plot[,"Cond.Total"],1)))
