Generates a plot of time series measurements
plot_ts(
  data,
  col_datetime,
  col_measure,
  lab_datetime = NA,
  lab_measure = NA,
  lab_title = NA
)
Arguments
- data
data frame of site id (optional), date/time, and measurement (e.g., wind speed).
- col_datetime
Column name, Date Time
- col_measure
Column name, measurement for plotting
- lab_datetime
Plot label for x-axis, Default = col_datetime
- lab_measure
Plot label for y-axis, Default = col_measure
- lab_title
Plot title, Default = NA
Value
a ggplot object
Details
Can be used with any parameter. A plot is returned that can be saved with ggsave(filename).
Labels (and title) are function input parameters. If they are not used the plot will not be modified.
The default theme is black and white.
The returned object is a ggplot object so it can be further manipulated.
Examples
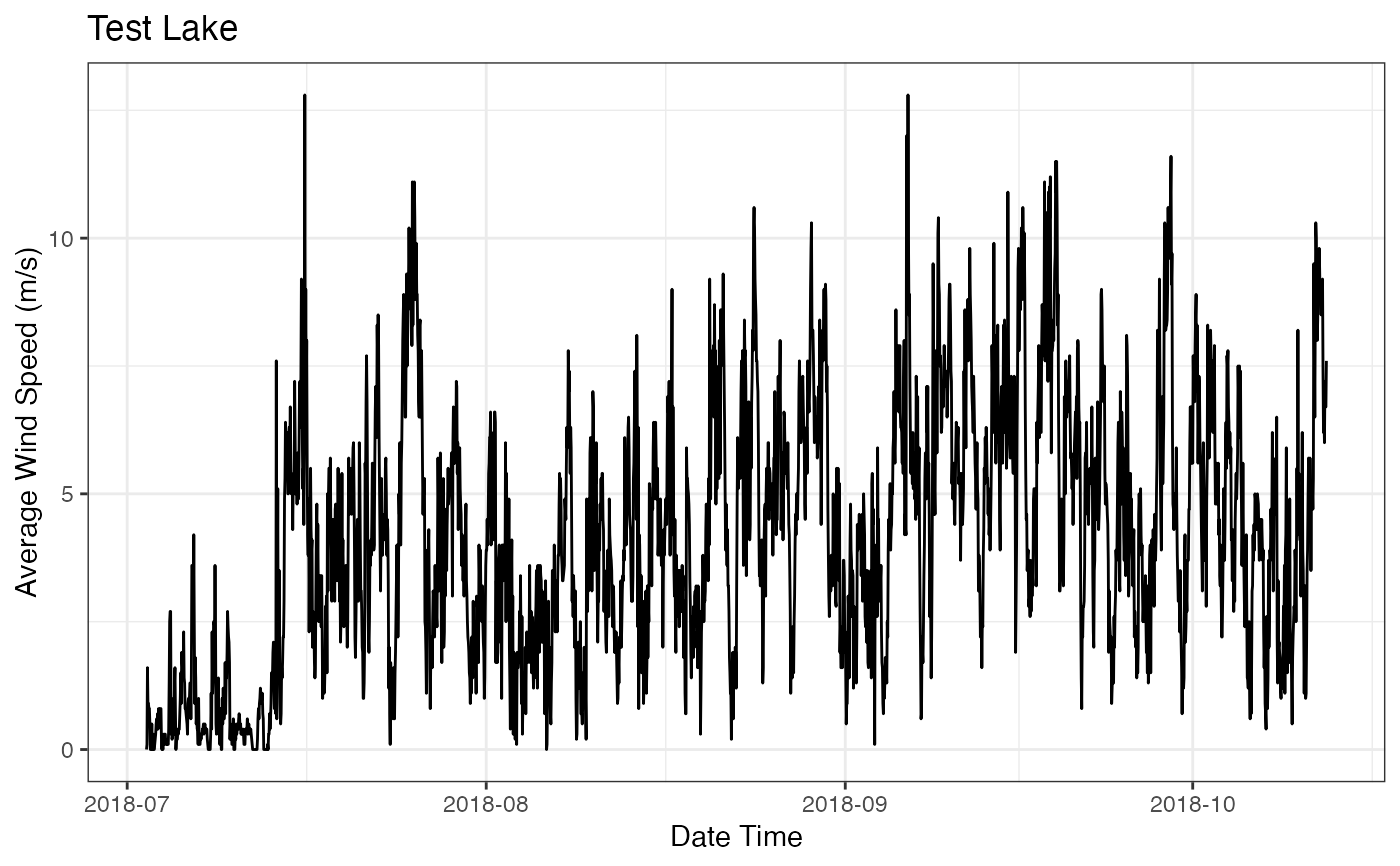
# Data (Test Lake)
data         <- laketest_wind

# Column Names
col_datetime <- "Date.Time"
col_measure  <- "WSPD"

# Plot Labels
lab_datetime <- "Date Time"
lab_measure  <- "Average Wind Speed (m/s)"
lab_title    <- "Test Lake"

# Create Plot
p_ts <- plot_ts(data = data
                , col_datetime = col_datetime
                , col_measure = col_measure
                , lab_datetime = lab_datetime
                , lab_measure = lab_measure
                , lab_title = lab_title)

# Print Plot
print(p_ts)


# save plot to temp directory
tempdir() # show the temp directory
#> [1] "/var/folders/24/8k48jl6d249_n_qfxwsl6xvm0000gn/T//Rtmp2bBrgJ"
ggplot2::ggsave(file.path(tempdir(), "TestLake_wind_plotTS.png"))
#> Saving 6.67 x 6.67 in image
# save plot to temp directory
tempdir() # show the temp directory
#> [1] "/var/folders/24/8k48jl6d249_n_qfxwsl6xvm0000gn/T//Rtmp2bBrgJ"
ggplot2::ggsave(file.path(tempdir(), "TestLake_wind_plotTS.png"))
#> Saving 6.67 x 6.67 in image