This function calculates metric scores based on a Thresholds data frame. Can generate scores for categories n=3 (e.g., 1/3/5, ScoreRegime="Cat_135") or n=4 (e.g., 0/2/4/6, ScoreRegime="Cat_0246") or continuous (e.g., 0-100, ScoreRegime="Cont_0100").
metric.scores(
  DF_Metrics,
  col_MetricNames,
  col_IndexName,
  col_IndexClass,
  DF_Thresh_Metric,
  DF_Thresh_Index,
  col_ni_total = "ni_total",
  col_IndexRegion = NULL
)
Arguments
- DF_Metrics
Data frame of metric values (as columns), Index Name, and Index Region (strata).
- col_MetricNames
Names of columns of metric values.
- col_IndexName
Name of column with index (e.g., MBSS.2005.Bugs)
- col_IndexClass
Name of column with relevant bioregion or site class (e.g., COASTAL).
- DF_Thresh_Metric
Data frame of Scoring Thresholds for metrics (INDEX_NAME, INDEX_CLASS, METRIC_NAME, Direction, Thresh_Lo, Thresh_Mid, Thresh_Hi, ScoreRegime , SingleValue_Add, NormDist_Tail_Lo, NormDist_Tail_Hi, CatGrad_xvar , CatGrad_InfPt, CatGrad_Lo_m, CatGrad_Lo_b, CatGrad_Mid_m, CatGrad_Mid_b , CatGrad_Hi_m, CatGrad_Hi_b).
- DF_Thresh_Index
Data frame of Scoring Thresholds for indices (INDEX_NAME, INDEX_CLASS,METRIC_NAME, ScoreRegime, Thresh01, Thresh02 , Thresh03, Thresh04, Thresh05, Thresh06, Thresh07 , Nar01, Nar02, Nar03, Nar04, Nar05, Nar06).
- col_ni_total
Name of column with total number of individuals. Used for cases where sample was collected but no organisms collected. Default = ni_total.#'
- col_IndexRegion
Name of column with relevant bioregion or site class (e.g., COASTAL). Default = NULL. DEPRECATED
Value
vector of scores
Details
The R library dplyr is needed for this function.
For all ScoreRegime cases at the index level a "sum_Index" field is computed that is the sum of all metric scores. Valid "ScoreRegime" values are:
* SUM = all metric scores added together.
* AVERAGE = all metric scores added and divided by the number of metrics. The index is on the same scale as the individual metric scores.
* AVERAGE_100 = AVERAGE is scaled 0 to 100.
FIX, 2024-01-29, v1.0.0.9060 Rename col_IndexRegion to col_IndexClass Add col_IndexRegion as variable at end to avoid breaking existing code Later remove it as an input variable but add code in the function to accept
Examples
# Example data
library(readxl)
library(reshape2)
# Thresholds
fn_thresh <- file.path(system.file(package = "BioMonTools"),
"extdata",
"MetricScoring.xlsx")
df_thresh_metric <- read_excel(fn_thresh, sheet = "metric.scoring")
df_thresh_index <- read_excel(fn_thresh, sheet = "index.scoring")
#~~~~~~~~~~~~~~~~~~~~~~~~
# Pacific Northwest, BCG Level 1 Indicator Taxa Index
df_samps_bugs <- read_excel(system.file("extdata/Data_Benthos.xlsx"
, package = "BioMonTools")
, guess_max = 10^6)
myIndex <- "BCG_PacNW_L1"
df_samps_bugs$Index_Name <- myIndex
df_samps_bugs$Index_Class <- "ALL"
(myMetrics.Bugs <- unique(
as.data.frame(df_thresh_metric)[df_thresh_metric[,
"INDEX_NAME"] == myIndex, "METRIC_NAME"]))
#> [1] "nt_total" "nt_EPT" "nt_BCG_att1i2" "x_Shan_e"
#> [5] "nt_longlived" "nt_Ephemerellid" "nt_Hepta" "nt_Nemour"
#> [9] "nt_Perlid" "nt_Rhya" "nt_ffg_pred" "nt_noteworthy"
# Run Function
df_metric_values_bugs <- metric.values(df_samps_bugs,
"bugs",
fun.MetricNames = myMetrics.Bugs)
#>
#> There are 1 missing fields in the data:
#> SAMP_AREA_M2
#>
#> If you continue the metrics associated with these fields will be invalid.
#> For example, if the HABIT field is missing all habit related metrics will not be correct.
#> Do you wish to continue (YES or NO)?
#> boo.Shiny == TRUE and interactive == FALSE
#> so prompt skipped and value set to '1'.
#> Warning: Metrics related to the following fields are invalid:
#> SAMP_AREA_M2
#> Updated col class; TOLVAL2 to numeric
#> Joining with `by = join_by(SAMPLEID, INDEX_NAME, INDEX_CLASS)`
# index to BCG.PacNW.L1
df_metric_values_bugs$INDEX_NAME <- myIndex
df_metric_values_bugs$INDEX_CLASS <- "ALL"
# SCORE Metrics
df_metric_scores_bugs <- metric.scores(df_metric_values_bugs,
myMetrics.Bugs,
"INDEX_NAME",
"INDEX_CLASS",
df_thresh_metric,
df_thresh_index)
# QC, table
table(df_metric_scores_bugs$Index, df_metric_scores_bugs$Index_Nar)
#>
#> Low
#> 0 10
#> 1 15
#> 2 15
#> 3 5
#> 4 2
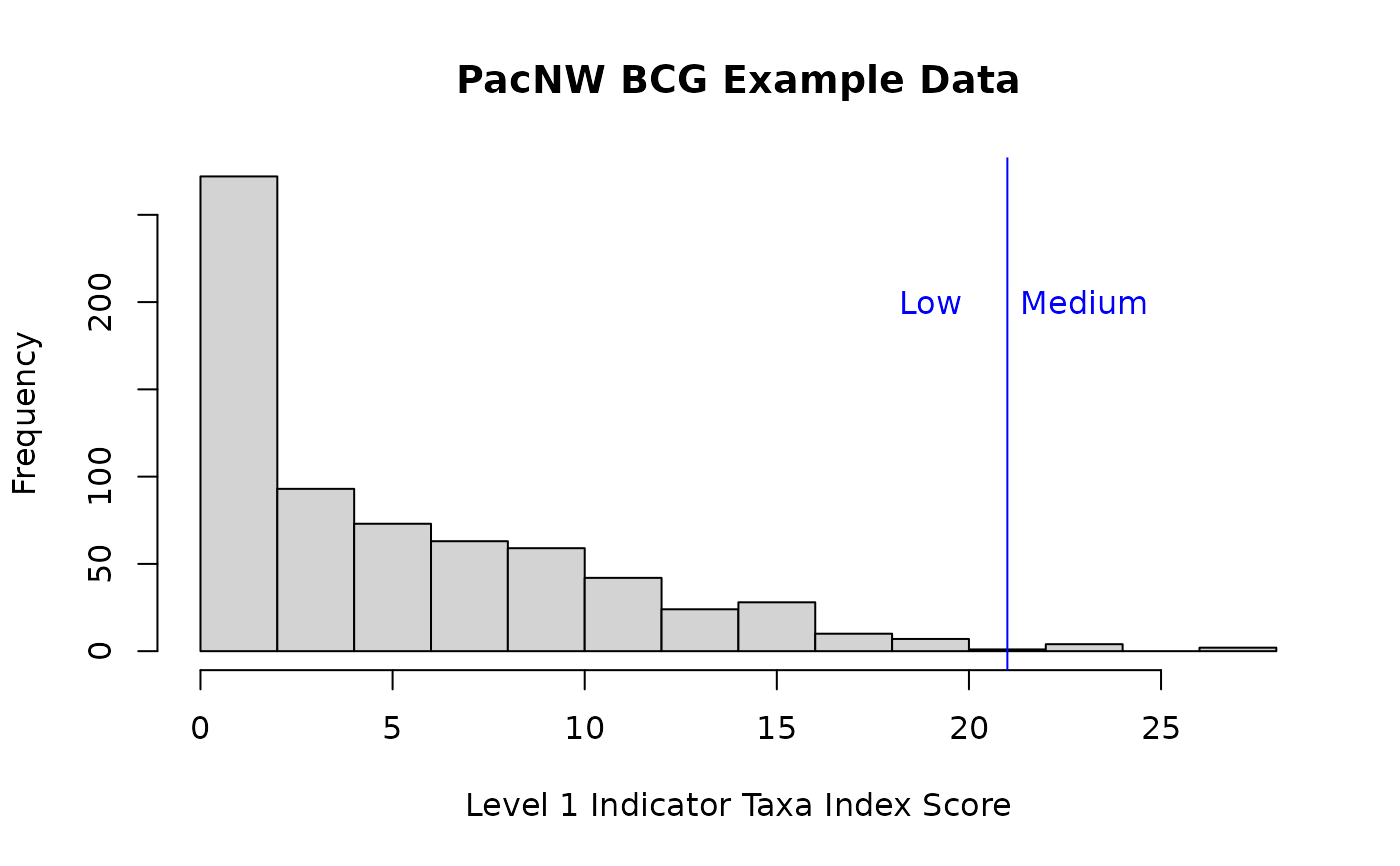
# QC, plot
hist(df_metric_scores_bugs$Index,
main = "PacNW BCG Example Data",
xlab = "Level 1 Indicator Taxa Index Score")
abline(v = c(21,30), col = "blue")
text(21 + c(-2, +2), 200, c("Low", "Medium"), col = "blue")