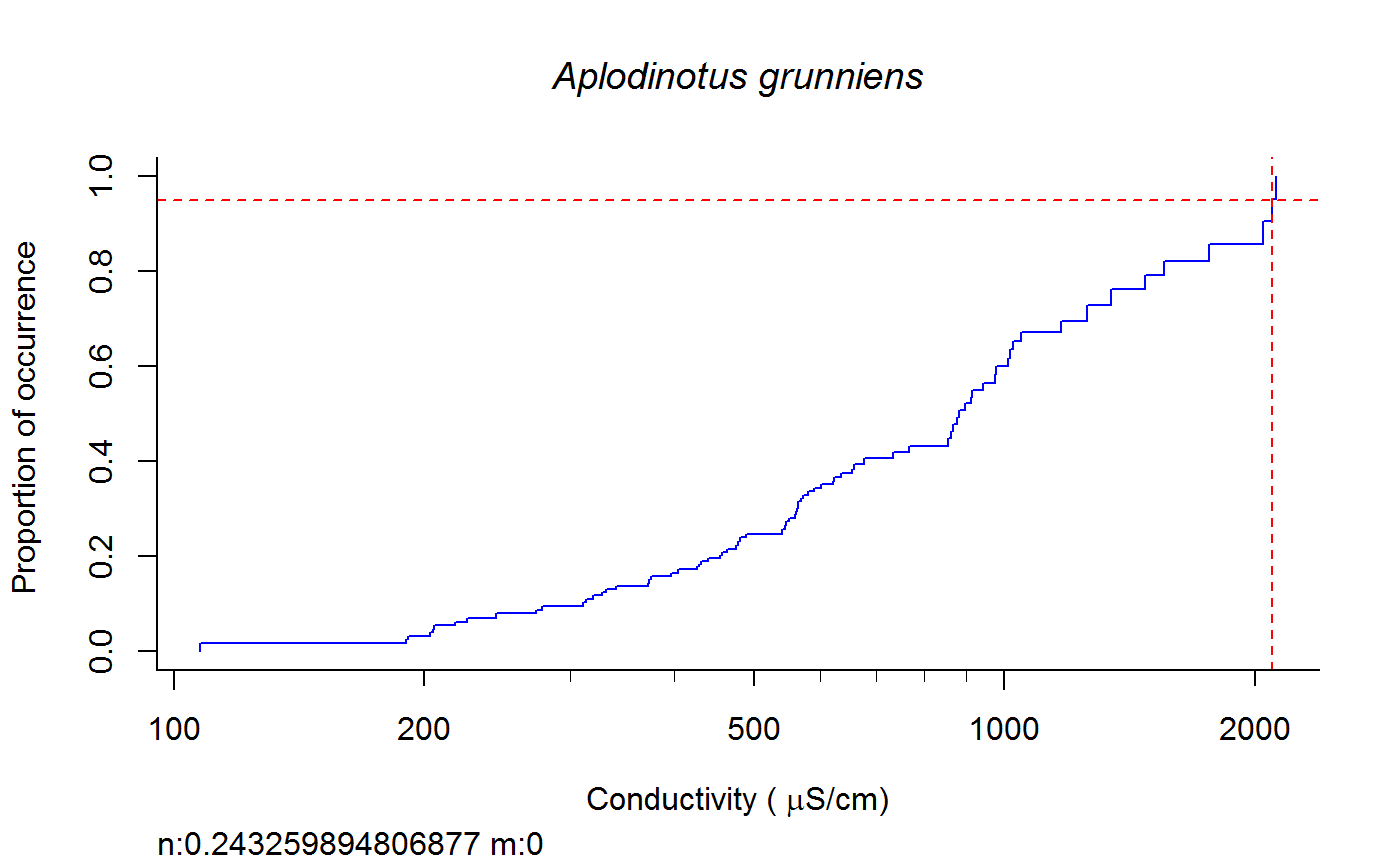
Weighted cdf function to calculate XC95 values #'
fish.wt.cdf(datafile = datafile, ss = ss, plot = T, dogam = T,
  SampleID = "Station_Date", tag = "", sortvect = NULL, np = 61,
  nt = 25, addtrend = T, wd = getwd(), groups = c("BigHUC",
  "ECOREGL3", "WS_AREA"), xvar = "cond")
Arguments
| datafile | environmental data, default = "datafile" from global environment. |
|---|---|
| ss | Species crosstabed data; default = "ss" from global environment. |
| plot | A boolean to choose if plot cdf and gam plots; default = T. |
| dogam | A booleen to choose if a gam fit is calculated; default = T. |
| SampleID | Site/sample id column; default = "Station_Date" |
| tag | Default = "". |
| sortvect | to provide a vector of species list so plots will be sorted according to the list; default = NULL. |
| np | Number of bins; default = 61. |
| nt | Minimum number of occurence; default = 25. |
| addtrend | A booleen if a trend should be added ( = ">" etc) in the output (T or F); default = T. |
| wd | Working directory for saving files. |
| groups | column names in datafile used for grouping the data; HUC (BigHUC), Ecoregion (ECOREGL3), and Watershed Area (WS_Area) |
| xvar | variable on which to base calculations; default = "cond" |
Value
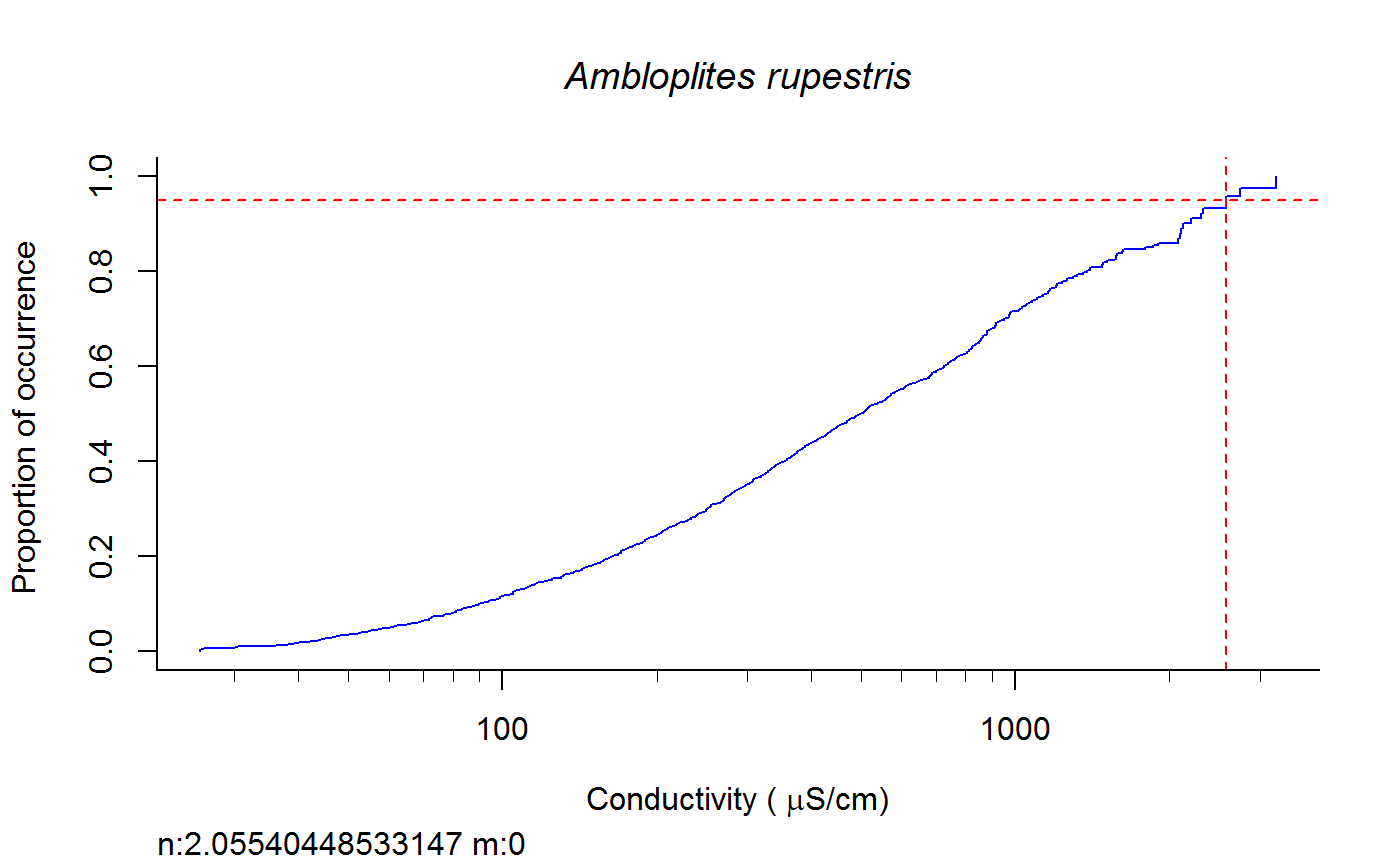
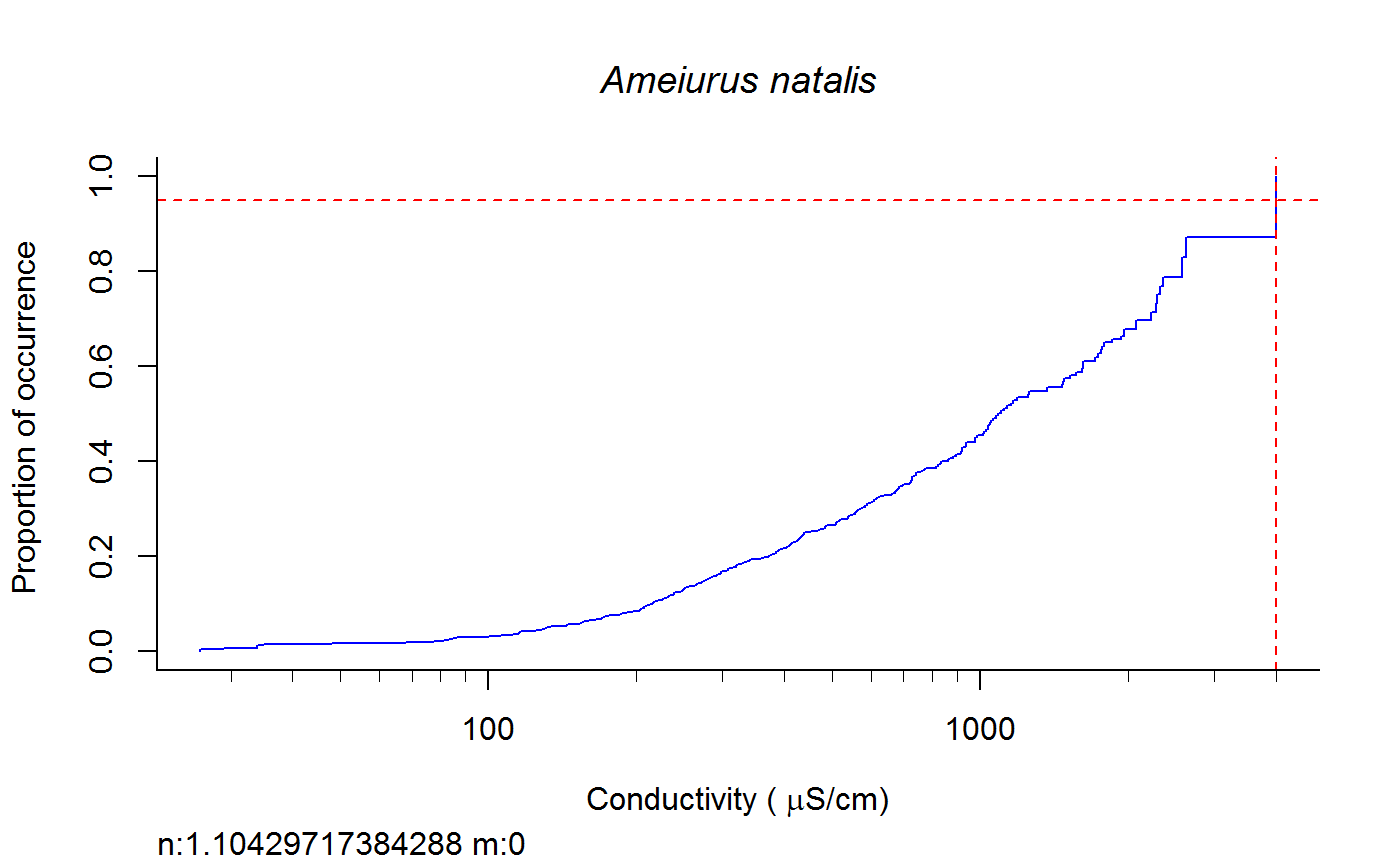
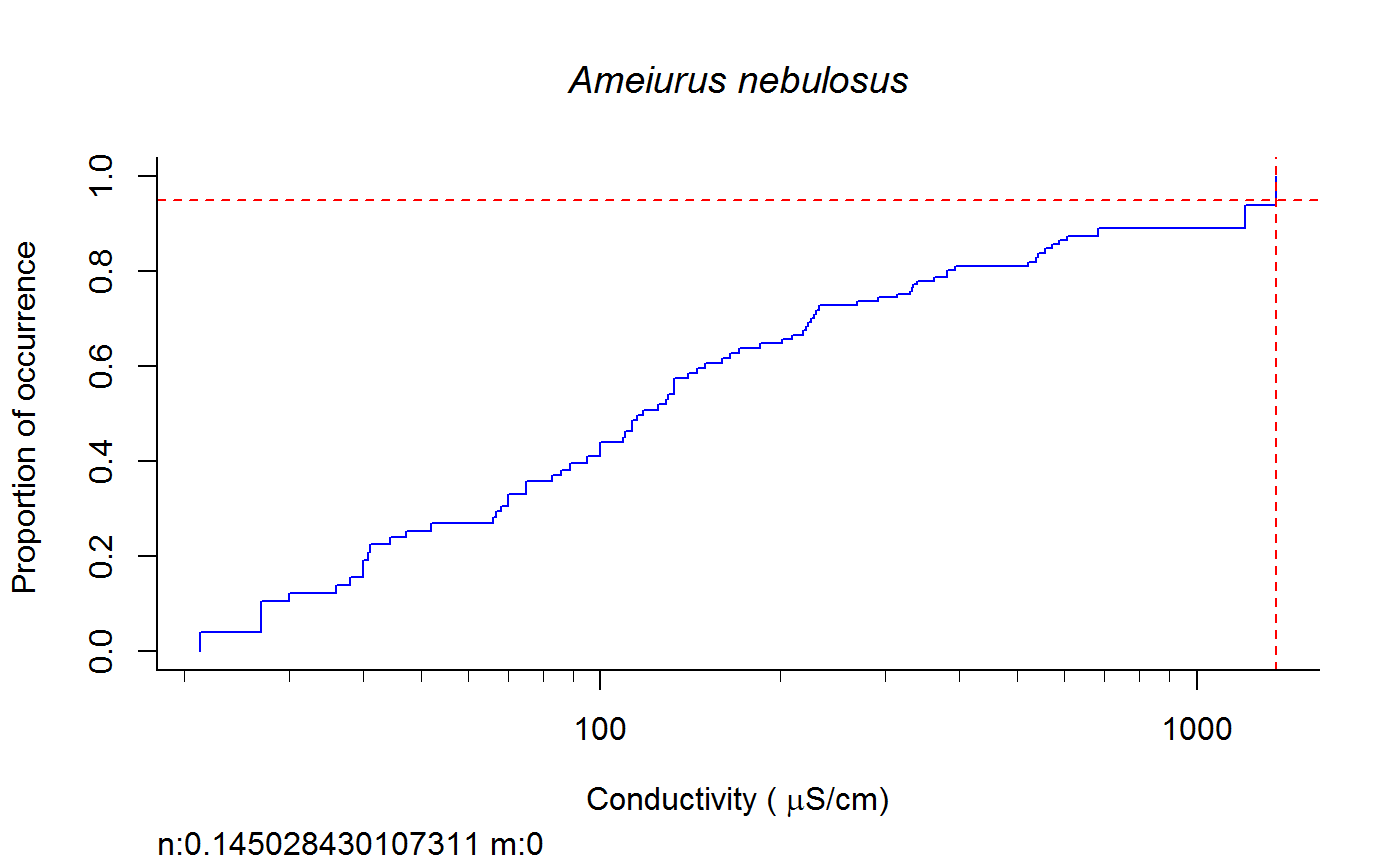
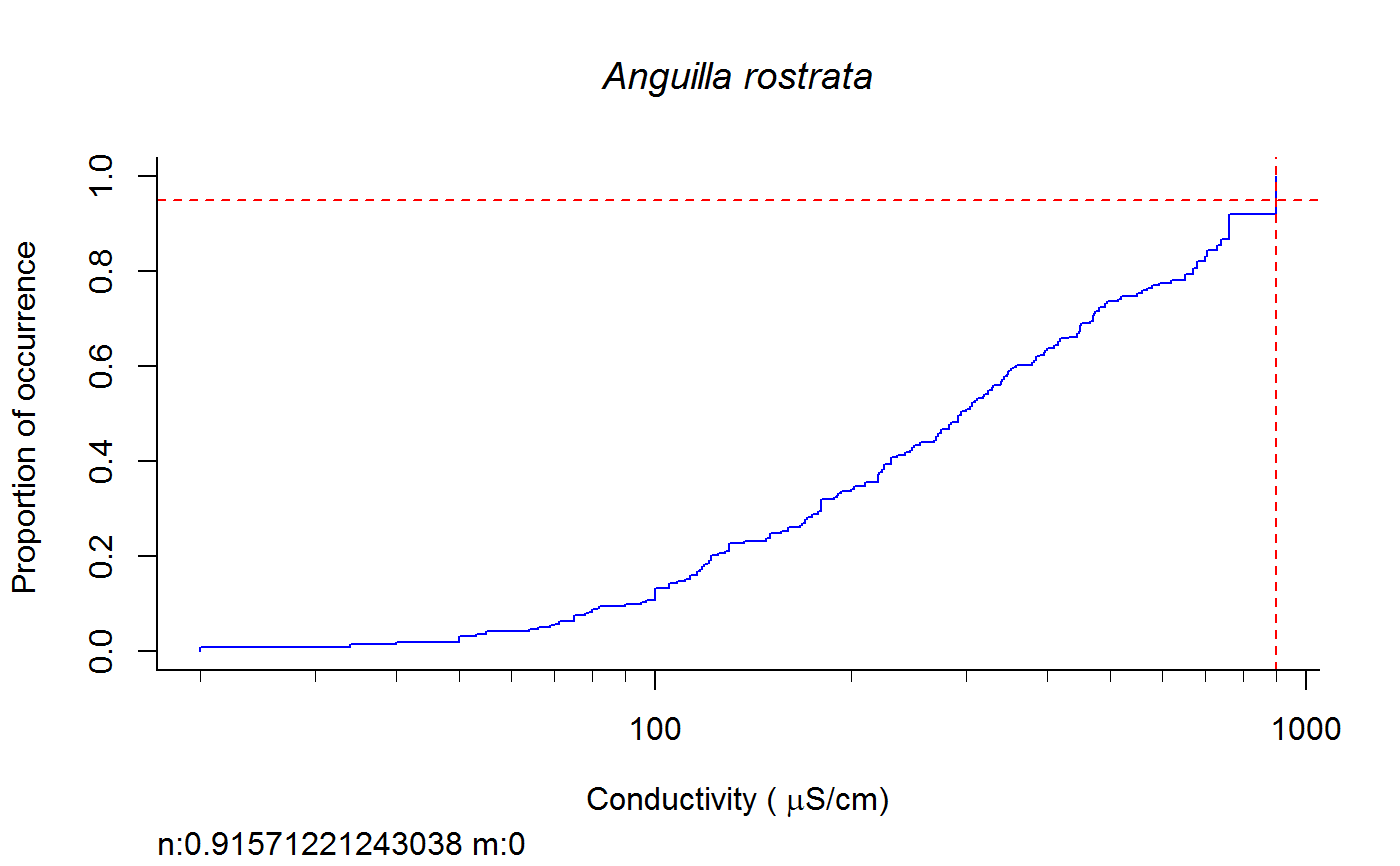
A dataframe of XC95 values and TIFF files of gam and/or cdf plots in the subdirectory "Results" of the directory specified by "wd".
Examples
# data
data(dta.do)
data(ss.sites)
# run function (~20 seconds)
dftv.do <- fish.wt.cdf(datafile = dta.do, ss = ss.sites, plot = T, dogam = T
                      , SampleID = "Station_Date", tag = "wt", sortvect = NULL
                      , np = 61, nt = 25, addtrend = T
                      , wd = getwd(), groups = c("BigHUC","ECOREGL3","WS_AREA")
                      , xvar = "cond")View(dftv.do)